.jpg)
Summary
- No-code UX analytics tool featuring heatmaps, session recordings, and user feedback collection
- Free tier available with 35 daily sessions and unlimited heatmaps for testing purposes
- Pricing structure from $39/month (Plus) to $389/month (Business) based on session volume
- Specialized focus on qualitative user behavior analysis for websites and web applications
- Native integrations with Google Analytics, HubSpot, Shopify, and 50+ popular web platforms
Understanding User Behavior Through Advanced Analytics
Hotjar transforms cold website data into actionable visual insights, revolutionizing how businesses understand their users' digital journeys. This behavioral analytics platform goes far beyond traditional metrics to reveal the "why" behind every user action on your website.
Unlike Google Analytics which tells you what happened, Hotjar shows you exactly how visitors interact with your pages. The heatmap technology literally highlights the hottest areas of engagement, revealing where users focus their attention and which elements drive or hinder conversions. This qualitative approach enables instant identification of high-performing and problematic page elements.
The platform primarily serves UX specialists, digital marketers, e-commerce owners, and product teams seeking to optimize user experience and conversion rates. Its no-code implementation makes it accessible to non-technical users, requiring only a simple tracking script installation across website pages.
How Hotjar Works: Core Features and Functionality
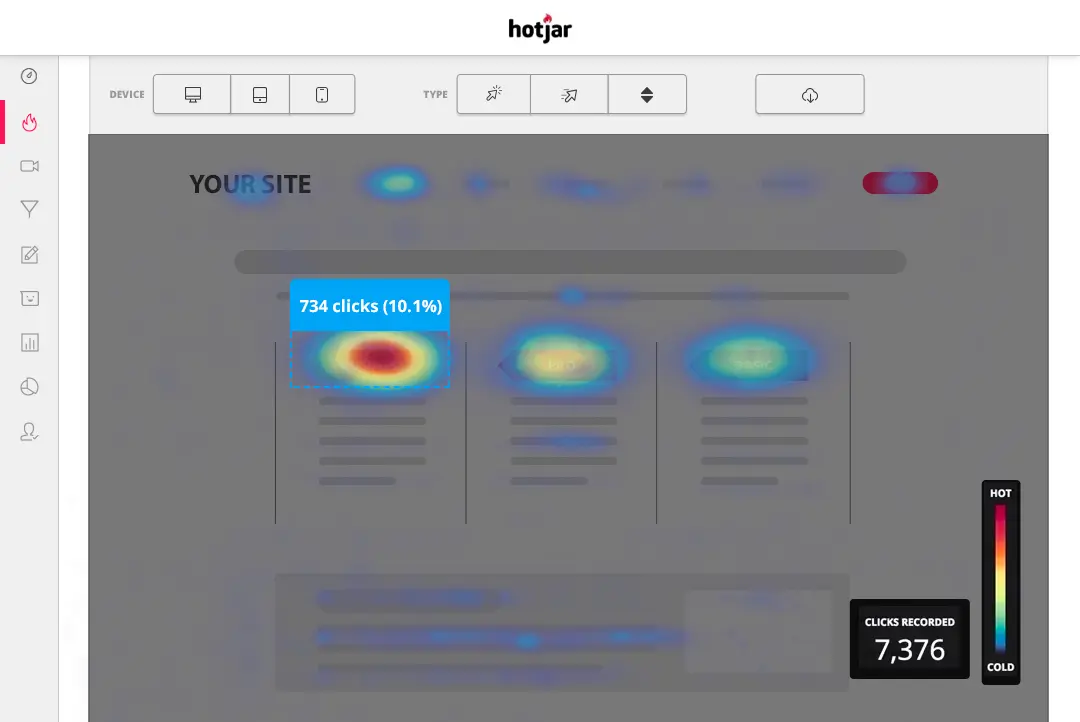
Hotjar operates through three complementary pillars that provide comprehensive user behavior insights. The first pillar, heatmaps, generates thermal visualizations showing user clicks, mouse movements, and scroll patterns. These maps instantly reveal engagement hotspots and blind spots across your web pages.
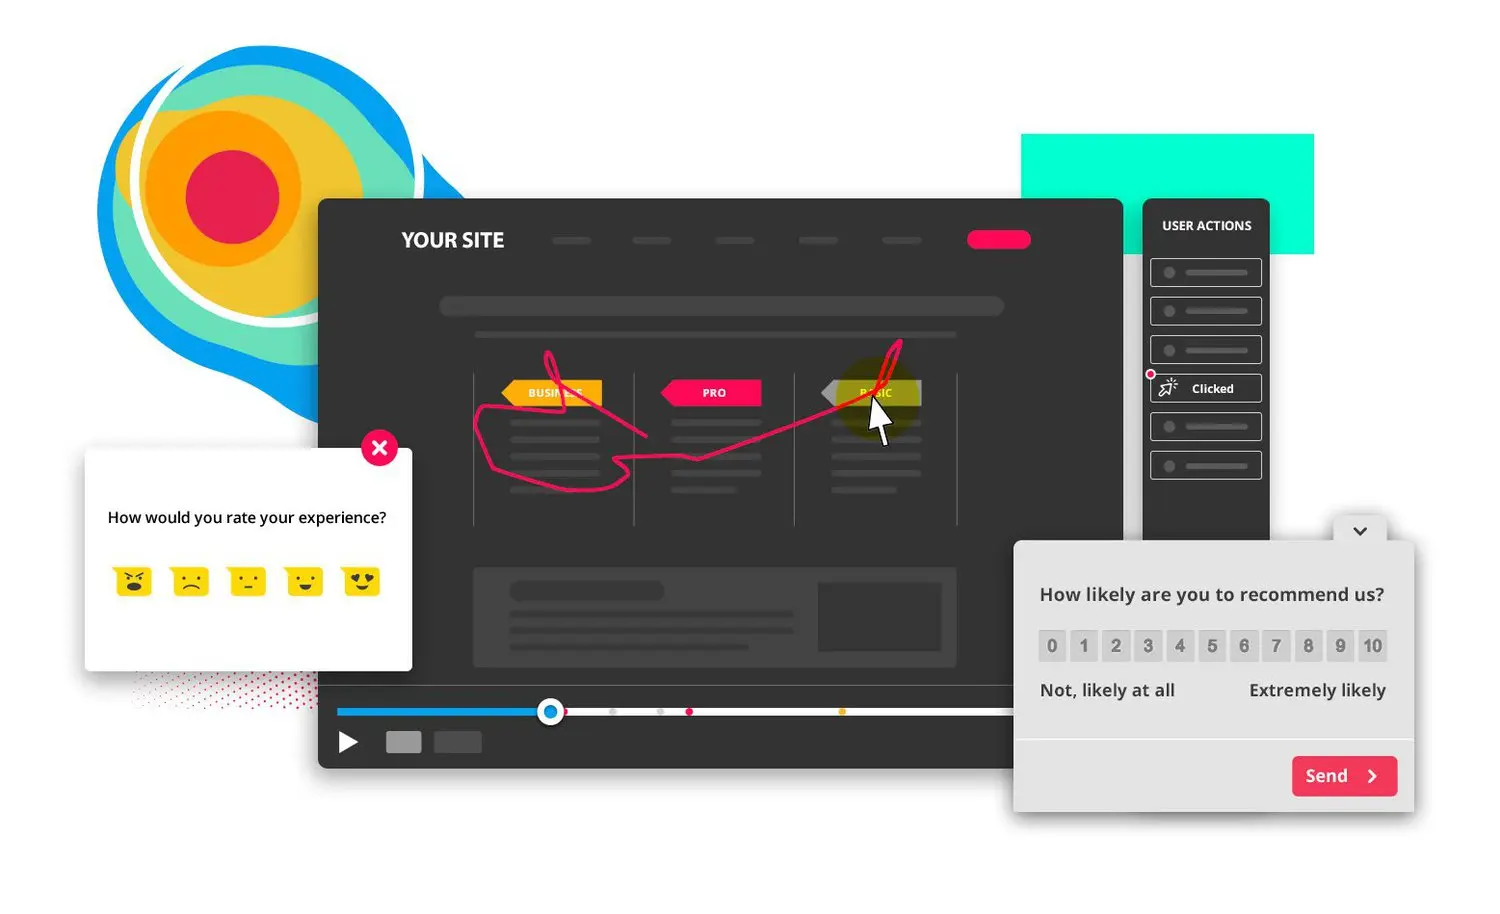
The second pillar features session recordings that faithfully reconstruct individual visitor journeys. These replays allow real-time observation of user hesitations, navigation errors, and friction points that may compromise user experience. Advanced filtering capabilities isolate sessions with rage clicks, JavaScript errors, or form abandonment patterns.
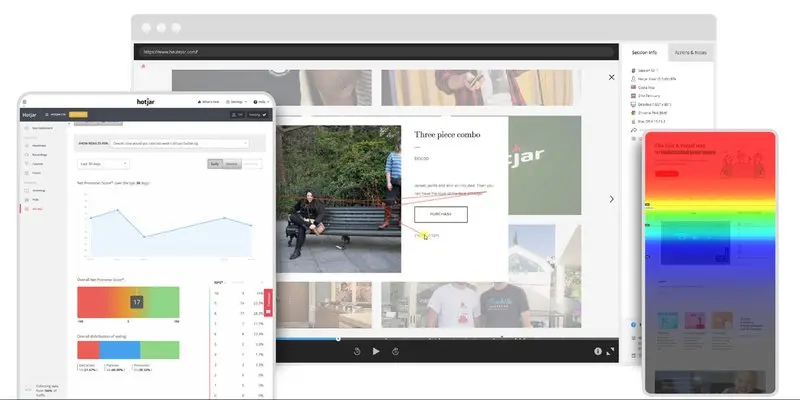
The third pillar incorporates feedback collection tools including contextual surveys, comment widgets, and user interview capabilities. This qualitative approach provides necessary context for correctly interpreting behavioral data patterns.
Hotjar's 2025 pricing structure offers multiple tiers to accommodate different business needs. The free plan includes 35 daily sessions, unlimited heatmaps, and three feedback widgets. The Plus plan at $39/month supports 100 daily sessions with advanced filtering features. The Business plan at $389/month handles 4,000 daily sessions and adds conversion analysis, funnels, and CRM integration.
Our Take on Hotjar's Performance
Hotjar distinguishes itself through an intuitive approach that democratizes behavioral analytics for teams of all technical levels. The clean interface enables rapid onboarding, even for analytics novices. Heatmap visualization represents a genuine asset for quickly identifying problematic zones and optimizing content layout.
Integration with existing tools proves seamless, particularly through Google Tag Manager which simplifies implementation. Native GDPR compliance provides confidence in personal data management, essential for European websites. Quality technical support and comprehensive documentation facilitate team skill development.
However, certain limitations become apparent with extended use. Session quotas can be restrictive for high-traffic sites, sometimes requiring sampling that may bias analysis. The absence of predictive analytics or automated suggestions necessitates manual data interpretation, which can be time-consuming for large datasets.
Hotjar Advantages and Disadvantages
Key Strengths
- Intuitive interface: Immediate adoption without technical training required, perfect for mixed teams
- Generous free tier: 35 daily sessions and unlimited heatmaps enable effective tool testing
- Excellent visualization: Heatmaps provide instant understanding of user engagement zones
- Robust integrations: Native compatibility with Google Analytics, HubSpot, Salesforce, and 50+ platforms
- GDPR compliance: Personal data management aligned with European regulations
Notable Weaknesses
- Restrictive quotas: Even paid versions may have constraining session limits for large websites
- Performance impact: Script may slightly slow page loading on certain configurations
- No AI integration: Zero automated optimization suggestions, requiring entirely manual analysis
Performance Results and ROI with Hotjar
Hotjar's effectiveness is measurably demonstrated through conversion rate improvements. A study conducted across 500 e-commerce sites using Hotjar revealed an average 18% conversion rate improvement after 6 months of behavior-based optimizations.
A particularly compelling client case involved a fashion e-commerce site that identified through heatmaps that 67% of visitors clicked on non-clickable product images. Fixing this UX friction generated a 31% increase in time spent on product pages and a 24% boost in cart additions.
Session recordings also reveal valuable insights about abandonment patterns. Analysis of a B2B website showed that 43% of users left the contact form at the phone number entry step. Removing this required field resulted in a 45% increase in completed forms, directly converting to additional qualified leads.
Frequently Asked Questions About Hotjar
Does Hotjar slow down websites?
Impact is typically minimal with an optimized script under 50KB. Hotjar loads asynchronously and doesn't affect initial page rendering. However, on sites with numerous plugins, slight slowdown may occur.
What does Hotjar actually cost?
The free version covers basic needs with 35 sessions/day. For professional use, expect $39/month minimum (Plus) or $389/month for high volumes (Business). Annual plans offer 20% discounts.
Is Hotjar GDPR compliant?
Yes, fully compliant with automatic anonymization of sensitive data, user consent respect, and data deletion capabilities on request. EU hosting ensures geographic compliance.
Can certain visitors be excluded from tracking?
Absolutely possible through settings or by adding users to an exclusion list. Ideal for excluding internal team members and obtaining data representative of real visitors only.
What's the difference from Google Analytics?
Google Analytics quantifies actions (how many, when), while Hotjar qualifies behaviors (how, why). Both tools complement each other: Analytics for global trends, Hotjar for understanding micro-interactions.
Hotjar Alternatives Worth Considering
Microsoft Clarity represents the most credible free alternative with unlimited heatmaps and recordings. Developed by Microsoft, this tool excels at JavaScript error detection but lacks Hotjar's feedback capabilities. For tight budgets, Clarity provides an excellent starting point.
Lucky Orange positions itself as a direct competitor with attractive value pricing. Starting at $39/month, it offers similar functionality enhanced with advanced form analytics and integrated live chat. Particularly suited for e-commerce sites thanks to detailed conversion funnels.
FullStory targets enterprises with advanced analytics needs. Its predictive analysis and user segmentation capabilities exceed Hotjar but come with greater complexity and cost. Ideal for product teams requiring deep behavioral insights. Within our tool ecosystem, Google Analytics remains complementary for quantitative analysis, while Ahrefs brings the SEO dimension to UX optimization.
Maximizing User Experience Optimization with Hotjar
Successful Hotjar implementation requires a methodical approach to maximize its potential. Start by identifying your critical pages: landing pages, product pages, conversion forms, and purchase funnels. These areas generate the most actionable insights for optimization.
Define measurable objectives before launching your analysis: reduce bounce rate by 15%, increase page time by 30 seconds, improve conversion rate by 20%. This results-oriented approach guides behavioral data interpretation and justifies implemented optimizations.
Heatmap analysis often reveals unexpected patterns: buttons ignored despite strategic positioning, intensely read content that doesn't convert, clicked elements that aren't actually clickable. These discoveries guide UX optimization priorities with direct business performance impact.
For agencies like Digidop, Hotjar becomes a client conviction tool by visually demonstrating the impact of UX recommendations. Heatmaps speak for themselves and facilitate client adoption of optimization recommendations, transforming hypotheses into undeniable visual evidence.
Sources and Resources
Sources: Official Hotjar Website - Analytics Tools Comparison on Capterra - Microsoft Clarity vs Hotjar Guide